Your guide to PPC budget management in Excel
Maximizing control over your PPC budget is crucial during downturns. Learn how to create an Excel pacing tracker for managing ad spend better.
Over the past month or so, nearly all the 2023 industry outlook articles I’ve perused (as well as my own) included a common theme:
Recessionary trends in the macroeconomy will pressure digital marketers to show the impact of their investments.
One of the core tenets I live by (and if my fiancée reads this, she’ll probably roll her eyes) is, “Focus on what you can control.” Translating this concept to PPC marketing, it is now more important than ever to put processes and tools in place to maximize control over your budgets.
Business objectives may change and have a ripple effect on our budgets, but we can control the funds allocated to the channel.
In a previous article, I highlighted PPC account structure strategies that you should consider when looking to increase cost-effectiveness. Today, I want to focus specifically on the topic of budget management.
I’ll start with some thoughts on my budget management philosophy and then jump into the tactical tips that can help increase your grasp on spend pacing.
A 4-point approach to PPC budget management
Four core budget management principles have helped me throughout my career. While there may be a few exceptions, the following generally hold true.
PPC campaigns are eligible for a finite amount of impressions
Budget management is key to success across all PPC channels. However, in search campaigns, I believe it is of heightened importance, as we do not have frequency settings at our disposal.
PPC campaigns are only eligible to deliver a finite number of impressions, based on the keywords and targeting settings applied.
Spreading budget evenly will result in better cost-efficiency than spending during a short, concentrated period
If you’ve ever received a lump sum of incremental at the end of a reporting period, you likely know what I am talking about.
Unless budgets are severely constrained – meaning, there is a large volume opportunity for your campaigns – you’ll likely have to enable less effective tactics, that will diminish your aggregate performance.
In addition, think about how conversion-focused automation features are designed to work.
They are attempting to prioritize your ad delivery toward users most likely to convert, while ultimately hitting your spend targets.
By spreading spend out over a longer period, you enable the algorithms to get “pickier” about when to show ads, increasing your efficiency.
Plan your investment strategy before launching the campaigns
It might seem like I’m stating the obvious here, but it’s a critical step that can often be overlooked.
The simplest approach is straight-line budgeting, but that often is not the optimal solution. Work with your leaders to align your spending patterns in the context of the broader business.
For example, if there’s a promotion planned during the flight, you may want to increase spend levels during that time.
Planning ahead allows you to understand how much you should be spending in the early days of the campaign and ensures you don’t run out of funds as the campaign ends.
Check your pacing tracker daily, even if it’s for a minute
As the great Pam Beasley once said, “Pobody’s nerfect.” Mistakes happen when managing search accounts.
One of the easiest ways to catch those mistakes? You guessed it, your pacing document.
Fluctuations in spend that deviate from expectations highlight that an unanticipated change has occurred and can have a critical impact on performance. Jump on top of them right away by checking your pacing daily.
If you’re questioning whether the time spent updating a pacing document daily could be better used elsewhere, I encourage you to keep reading.
Using the tips and techniques outlined below, you can create a tracker that takes seconds to update.
Excel tips and tricks for your PPC pacing tracker
One of my favorite parts of search marketing is that there is rarely a one-size-fits-all solution.
Similar to PPC account structures, the design of your spend tracker should absolutely be tailored to your business. Take these ideas, run with them, and put aside the ones that don’t make sense.
There are four core components of every PPC budget pacing tracker that I create in Excel. You can think of each of these as separate tabs in the workbook. They are:
- Raw platform data.
- The detailed budget tracker (one per managed budget).
- The delta graph.
- The executive/summary view.
Each of these tabs has a different intended audience and purpose. We’ll start with the most granular and work our way up to the high-level views.
My advice would be to tackle one step at a time. Next to each section header, I’ll provide a rough estimate of how long each step may take, pending your experience in Excel.
Part 1: Raw platform data (30-60 minutes)
A key element of any pacing document is going to be the actual spend data you are importing from the platform. As for the data imported, I always advise keeping it simple, yet granular.
In most cases, I design a simple dataset with three columns: Date, Campaign, and Spend.
Labels can also be an effective tool for associating campaigns with budgets, depending on the complexity of your account.
That said, the more interesting conversation is not about what data you are importing, but how the data is getting there.
There are many options for how to approach data imports. Below are a couple of different flavors (though I would encourage you to reach out to your analytics team, as they may have additional ideas based on how your data is stored/structured):
- Scheduling reports in the platform: Most PPC platforms have a report scheduling feature available that is easy to use, ensuring the previous day’s data is sitting in your inbox when you hop online. This is where I recommend starting your journey if you are new to pacing automation.
- Web links: Some campaign management tools, such as Search Ads 360, allow you to create custom URLs for your reports. This eliminates the need to manually import data via copy and paste, as you will using the previous option.
- Query connections: Similar to web links, you can create connections to data tables in analytics platforms. This approach allows you to refresh and update your data in real time. However, it requires SQL proficiency, so I always advise consulting your analytics team if exploring this route. If that is not possible, circle back to the first option.
Remember, it doesn’t matter how your data gets to the pacing document, so long as it is comprehensive and accurate.
The time saved using one of the automated data connections described above – instead of copying/pasting reports – is minimal. The biggest difference is the elimination of the potential for human error.
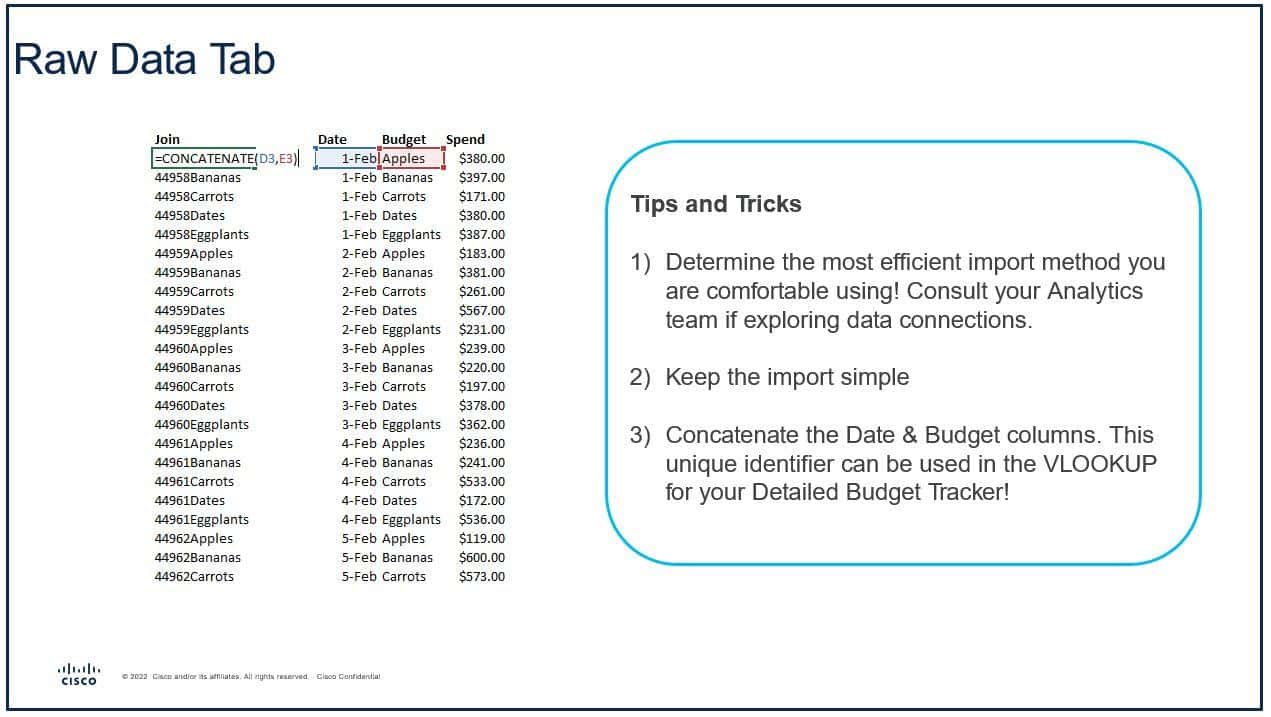
Once you have the data in the workbook, the only manipulation required is the creation of the join, which is simply the unique identifier you will reference to VLOOKUP the data into the detailed budget tracker (more in the next section).
When creating a join, there are some simple considerations to keep in mind:
- Make sure your date column is one of the elements of the concatenate, as you want to pull in spend by day.
- The nomenclature used for budget names must be consistent throughout the document, including in the “Raw data” tab.
Below is an example of what this concatenate could look like.
Get the daily newsletter search marketers rely on.
See terms.
Part 2: The detailed budget tracker (1-2 hours)
These tabs are the core of the pacing document, as they marry your actual spend performance to the spending plan. You should have one detailed budget tracker per budget you are managing.
That might sound redundant, but here's the trick – if you build the first one using formulas and references, it can be quickly duplicated and adjusted for your other line items!
I'm going to start with a snapshot of the detailed budget tracker and then provide an overview of how to automate each element so that it is easily replicable.
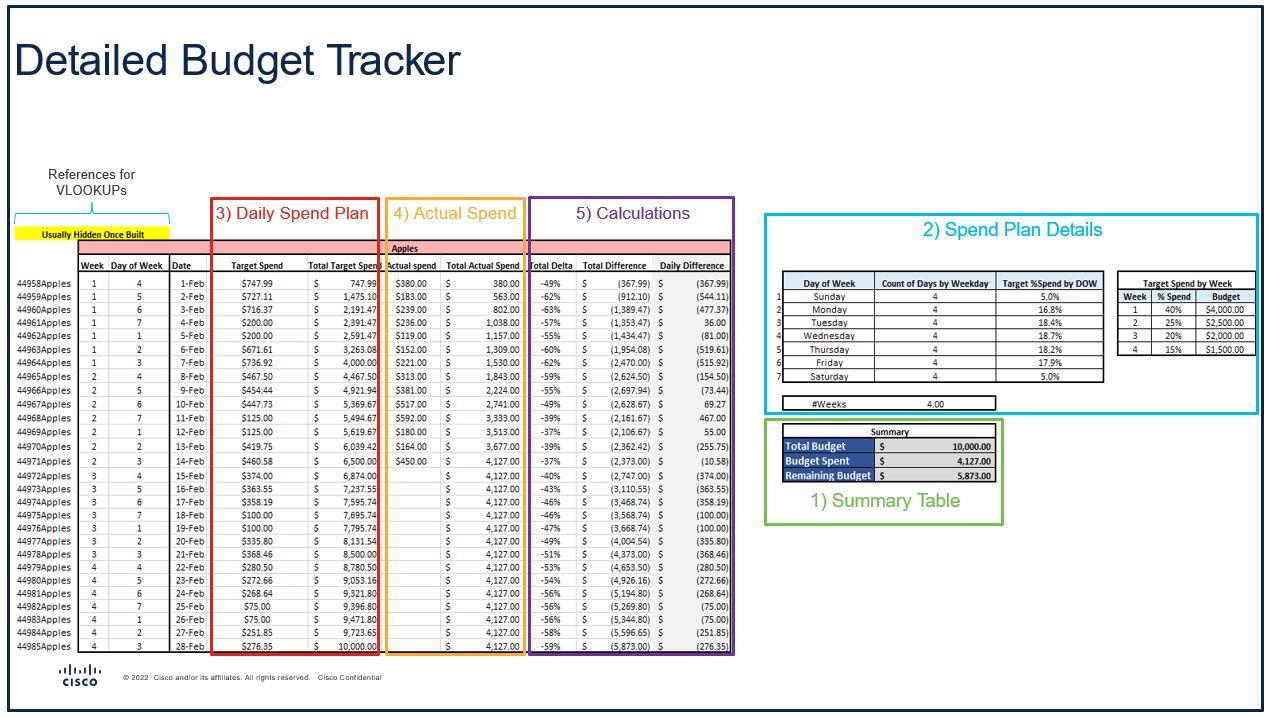
1. Summary table
A simple overview of what the total budget is and how much we've spent to date. Each budget should only be hardcoded in one cell in the document.
I tend to do the hard coding on the "Executive summary" (the final section covered in this article), but you could do it here as well. Your budget spent and remaining budget should be set up as calculations so that they update dynamically.
2. Spend plan details
A critical element that needs to be customized based on the budget duration, business needs, and your understanding of consumer behavior. Here, I recommend leaning on historical data as much as you can.
One small tip: See that list of numerals next to the Day of Week column? That's for the VLOOKUP we're about to create. It enables you to use the WEEKDAY function when automating your VLOOKUP references.
3. Daily spend plan
Mapping out target daily spends sounds daunting, right?
Good news! We can use VLOOKUPs and math to make this an easy, dynamic calculation.
If I were to write as an equation, it is:
Daily Spend = [Target Spend for Week] * [Target %Spend by Day of Week]
In Excel, I write a VLOOKUP for each component of the equation, referencing the details we compiled in the spend plan.
(If you want a reminder on VLOOKUP best practices, check out my previous article, How to level up your analytical skills with Excel.)
The Total Target Spend column simply aggregates the target spends over time. The easiest way to do this is [Today's Target Spend] + [Yesterday's Total Target Spend]. You can see how that column adds up to $10,000, which aligns with our summary table.
4. Actual spend
Does that column on the far lefthand side look familiar? It should, as that's the join from our "Raw data" tab.
The trick I use here is concatenating the date to the Title row (shaded in Red). When thinking about duplicating the tab and creating a detailed budget tracker, all you need to update is the table's title.
Similar to the previous step, this is a VLOOKUP of the join, pulling in the spend from our "Raw data" tab. I then use the same exact approach as the previous step for the Total Actual Spend.
5. Calculations
These are calculations I build based on the Target and Actual Spends we incorporated in the previous two steps.
When it comes to the delta, make sure you are using the Total columns, as opposed to the Daily Target/Actual Spends.
Note: In each of the five steps listed above, we are only using formulas. I can't stress this enough – though it may take longer to create initially, this is what allows your detailed budget tracker to be replicable for additional budgets or for new quarters.
You may wrestle with the formulas at first, but once you have a strong template, budget management processes will become much more efficient – as the only details you'll need to update are the Budget Name, Budget Amount, and potentially, your Spend plan details table.
Part 3: The delta graph (15-60 minutes)
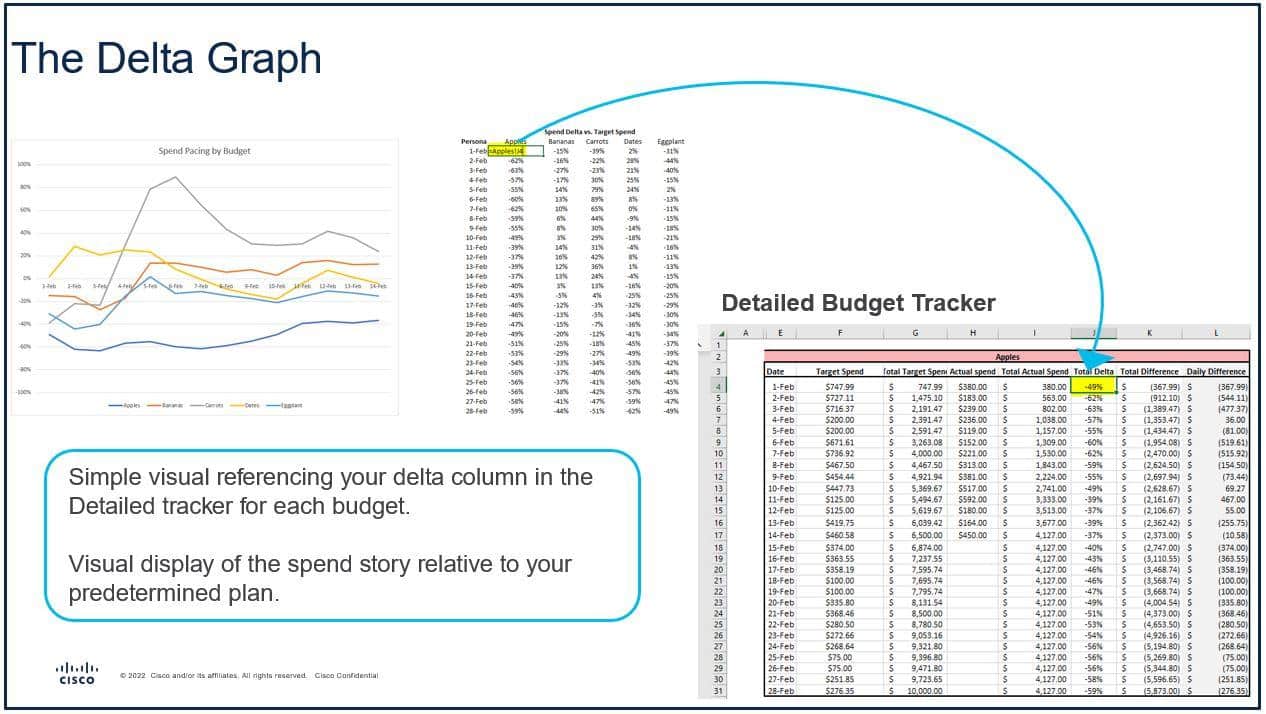
The purpose of this feature is to create a simple view of how all campaigns are pacing relative to the predetermined plan. In a perfect world, all budgets would have a 0% deviation from the plan, but that is rarely the case in real life.
This is one of the easiest parts to set up, as you've already done the heavy lifting.
As you can see in the visual below, this is a simple reference to the "Detailed budget tracker" tab you've already created. Set up one column for each detailed budget tracker you created in the previous step.
A couple of tips as it relates to this component of the pacing tracker:
- Remember that 0% is the ideal target here. The closer to 0%, the more tightly aligned spend is to your plan. If your audience isn't very data-centric, it might be helpful to make that visually apparent. Sometimes, I'll include a transparent green box between the -20% to 20% range to illustrate.
- Typically, I keep the vertical axis range set at -1 to 1. However, as you approach the end of the flight, you may want to "zoom in" by decreasing to -0.5 to 0.5 or even further.
Part 4: The executive/summary view (30-90 minutes)
We save this one for last, as it is largely built off the work you've already done.
The purpose of this view is to complement the delta graph with a bit more context and some of the basic data points leaders will be curious to know.
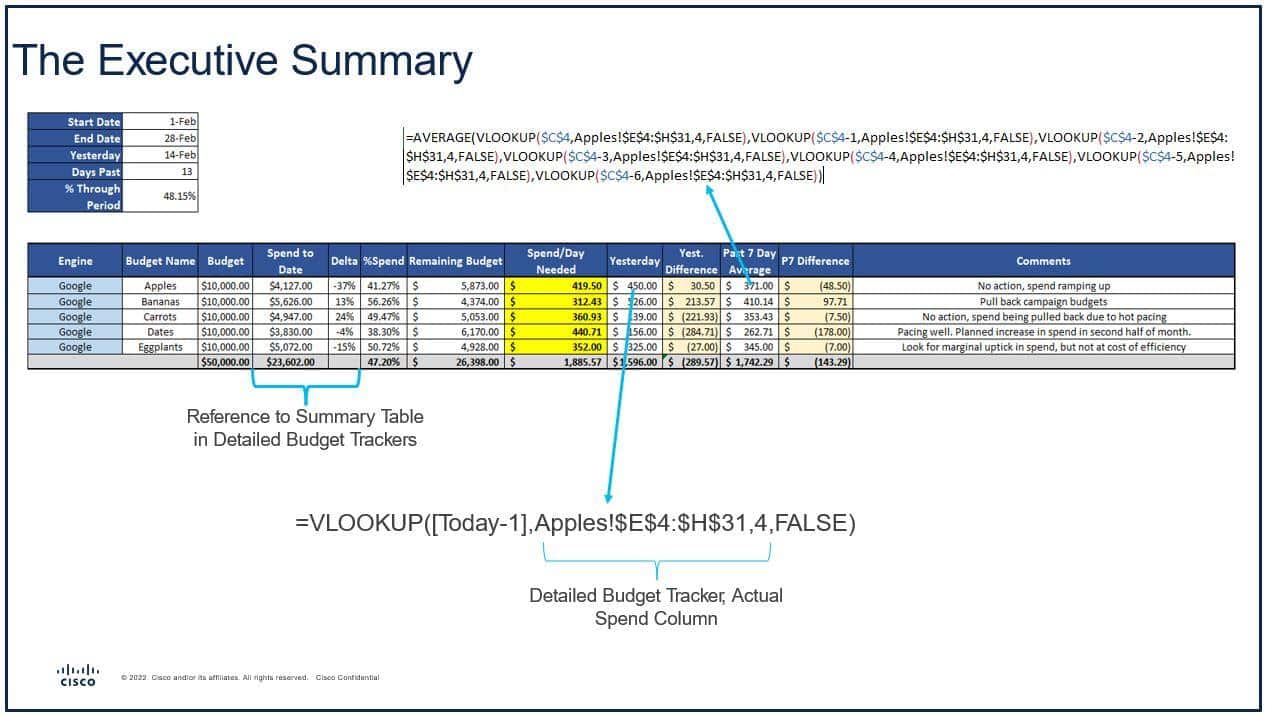
Some thoughts regarding the executive summary:
- As mentioned in the detailed budget tracker overview, this is the only tab where I hardcode any cells. The Dates table and the Engine/Budget Name/Budget Amount columns are the only hard-coded cells.
- With this being an executive view, the argument could be made to further reduce the number of metrics. I like to include Yesterday and Past 7-Day Average metrics as they help contextualize whether the previous day was abnormal or in line with the recent trend. This view should be adjusted based on your audience.
- Creating the summary using formulas and references makes it easy to replicate for new campaigns or flights. The Past 7-Day Average metric looks messy and difficult to create, but it's quite easy using a simple trick. Once you write the VLOOKUP, you just need to copy and paste. The only update to make is the date you are referencing (
$C$$-Xin the formula above).
Boost your PPC budgeting performance and reduce the effort with Excel
Investing time to enhance your pacing processes and tools at the beginning of 2023 is a worthwhile endeavor.
During turbulent times, maximizing available budgets is critical – and it starts with creating a spending plan and adhering to it.
Implementing the techniques described in this article will reduce the aggregate time spent on pacing updates, while also providing views that enable a quick response when things go awry.
In addition, once your template is automated, it will be easily replicable and only requires a couple of cell changes to complete updates for a new month or quarter.
Opinions expressed in this article are those of the guest author and not necessarily Search Engine Land. Staff authors are listed here.
Related stories
New on Search Engine Land
This day in search marketing history: February 9
Twitter is down, globally
Twitter Blue subscribers can now Tweet 4,000 characters
Cost-Per-Hour Masthead placements: YouTube’s latest offering
Pinterest puts more emphasis on its shoppable video feature


