


Top 5 data feed errors that can sabotage your ecommerce campaigns
New research reveals what feed tactics retailers are using to increase their campaign performance – and where retailers go wrong.
Since the start of the pandemic, supply chain issues have caused panic among retailers. On average, 16% of products are out of stock and cannot be purchased. Industries such as vehicles (57%) and sporting goods (40%) are hit especially hard. There are also large differences in geographic locations, with Latin America experiencing one of the lowest levels of stock availability.
Interestingly, when excluding those out-of-stock items from a Google search campaign, advertisers typically see a 181% ROAS increase.
These statistics come from a new DataFeedWatch report based on insights from 4.5 million products, 15,000 shops and more than 60 countries. Uncovering industry trends, common errors and optimization tactics, the report provides retailers and advertisers with actionable data to evaluate their feeds, channels and strategy.
Data feed errors and common pitfalls
The most common feed issues often included missing or incorrect data and wrongly formatted attributes.
Magento merchants struggle with almost 10% of products affected by feed errors. Merchants using Magento struggle with having almost 10% of their advertised products affected by errors. This number exceeds the industry average of 7%.

BigCommerce and WooCommerce pull in 7.03% and 8.27% of all feed errors, respectively.
Shopify sellers record the best result of data feed health with only 5.47% disapproved listings. Interestingly, DataFeedWatch speculates that the volume of feed errors is likely an indicator of the level of data management complexity within the platform.
Shipping and issues are responsible for 23.49% of all product ad disapprovals. Shipping is the most troublesome aspect of product data setup. The most common errors are too-high values and unspecified attributes like missing shipping country.

Image attribute issues are responsible for 20.32% of all disapprovals. This is likely due to having a relatively high number of requirements. Top image errors include:
- Promotional overlays on images.
- Images that are too small.
- Missing or invalid images.
- Generic visuals.
GTIN issues account for 5.5% errors. Submitting incorrect GTIN values, or skipping GTINs altogether accounts for just over 5% of issues.
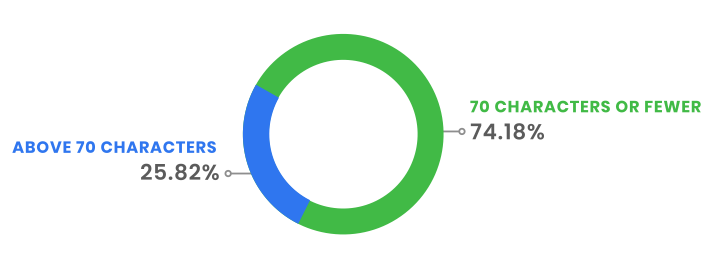
Title issues. 25.82% of titles across Google Shopping listings go above 70 characters. This means that reduced visibility can be an issue if titles are trimmed.
In Google Shopping, product titles have a total character allowance of 150, but are trimmed after 70 characters. Since 25.82% of titles across Shopping listings go above 70 characters, important product data may not be visible.
Feed tactics
Most retailers use feed tactics to increase their campaign performance. When retailers advertise on multiple channels, different feed data may be required, increasing the likelihood of advertisers needing to leverage secondary data sources.
Whether you’re creating new titles or segmenting based on “bestsellers” or margins, optimizing data feeds has a positive effect on campaign performance.
Product titles are the most optimized pieces of data in a product feed. Out of all shops that had overwritten data, 14% of those changes were to the product titles. Advertisers either changed several keywords or rewrote the titles from scratch.
Two out of five ecommerce advertisers use custom_labels to optimize their campaigns. 13% of those advertisers create product groups based on if the product is in an ongoing sale.
When advertisers segmented their feeds based on margins, they saw a 96% increase in ROAS.
64% of ecommerce businesses filter less profitable products. In almost all occurrences of merchants cutting products it’s because the prices drop below a certain threshold.

Price is the #1 reason for removing products from campaigns. When excluding products from paid ads based on the item price, 90.92% of marketers choose to remove goods below a specified price point.
Only 9% of marketers filter products based on highest price points.
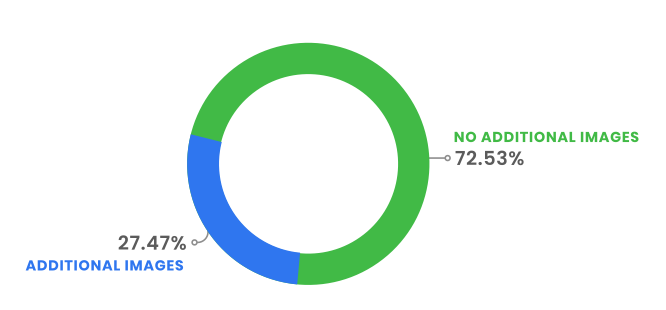
Over 25% of online merchants provide ad platforms with additional images. Additional images usually show the product from a different angle or with staging elements. This gives shoppers the best possible idea of what they’re buying and how the product can be used.
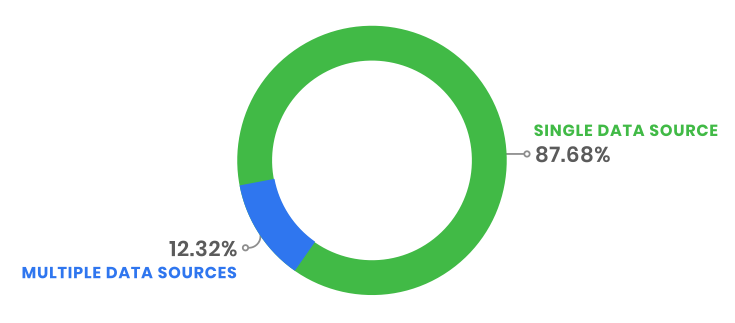
At least one in 10 ecommerce advertisers supply additional product info in the feed by leveraging secondary data sources. Types of secondary data sources used include:
- Inventory management systems
- Analytics
- Google Sheets
You can download the full PDF report from DataFeedWatch here. It includes more information on the current state of ecommerce shopping including tips for advertisers to optimize and enhance their feeds, choosing the right platforms and best practices for paid ad campaigns.
New on Search Engine Land
Top 5 data feed errors that can sabotage your ecommerce campaigns
4 tips to get the most out of the Google Ads interface
Webinar: 5 ways to survive an uncertain economy
YouTube updates Masthead ad requirements to allow sports betting
Google is rolling out new campaign and ad group Setup columns


